ECON 110: Introductory Economics
Exam 3 Review
Exam 3 Topics
Exam 3 Review: Chapters 24 to 27
Topics covered:
Chapter 24: Measuring gross domestic product; the four components of spending; real versus nominal GDP; the GDP deflator; what GDP misses
Chapter 25: Constructing the consumer price index; CPI versus the GDP deflator; correcting for inflation; real versus nominal interest rates
Chapter 26: Productivity and its determinants; why living standards differ across countries; economic growth and public policy; the catch-up effect
Chapter 27: Financial institutions; the relationship between saving and investment; the market for loanable funds; what determines the real interest rate
Exam 3 Review: Chapters 29 to 31
Topics covered, continued:
Chapter 29: Identifying and measuring unemployment; why unemployment persists; job search, minimum wages, unions, and efficiency wages
Chapter 30: What money is and what it does; the Federal Reserve System; banks and money creation; the tools of monetary control
Chapter 31: The quantity theory of money; the classical dichotomy; the Fisher effect; the costs of inflation
Chapter 34 is not on this exam.
Exam 3 Key Concepts
Chapter 24 Key Concepts
- microeconomics
- macroeconomics
- gross domestic product (GDP)
- consumption
- investment
- government purchases
- net exports
- nominal GDP
- real GDP
- GDP deflator
Chapter 25 Key Concepts
- consumer price index (CPI)
- inflation rate
- core CPI
- producer price index (PPI)
- indexed
- nominal interest rate
- real interest rate
Chapter 26 Key Concepts
- productivity
- physical capital
- human capital
- natural resources
- technological knowledge
- diminishing returns
- catch-up effect
Chapter 27 Key Concepts
- financial system
- financial markets
- bond
- stock
- financial intermediaries
- mutual fund
- national saving (saving)
- private saving
- public saving
- budget surplus
- budget deficit
- market for loanable funds
- crowding out
Chapter 29 Key Concepts
- labor force
- unemployment rate
- labor-force participation rate
- natural rate of unemployment
- cyclical unemployment
- discouraged workers
- frictional unemployment
- structural unemployment
- job search
- unemployment insurance
- union
- collective bargaining
- strike
- efficiency wages
Chapter 30 Key Concepts
- money
- medium of exchange
- unit of account
- store of value
- liquidity
- commodity money
- fiat money
- currency
- demand deposits
- Federal Reserve (Fed)
- central bank
- money supply
- monetary policy
- reserves
- full-reserve banking
- fractional-reserve banking
- reserve ratio
- money multiplier
- bank capital
- leverage
- leverage ratio
- capital requirement
- open-market operations
- discount rate
- reserve requirements
- interest on reserves
- federal funds rate
Chapter 31 Key Concepts
- quantity theory of money
- nominal variables
- real variables
- classical dichotomy
- monetary neutrality
- velocity of money
- quantity equation
- inflation tax
- Fisher effect
- shoeleather cost
- menu costs
Exam 3 Graphs
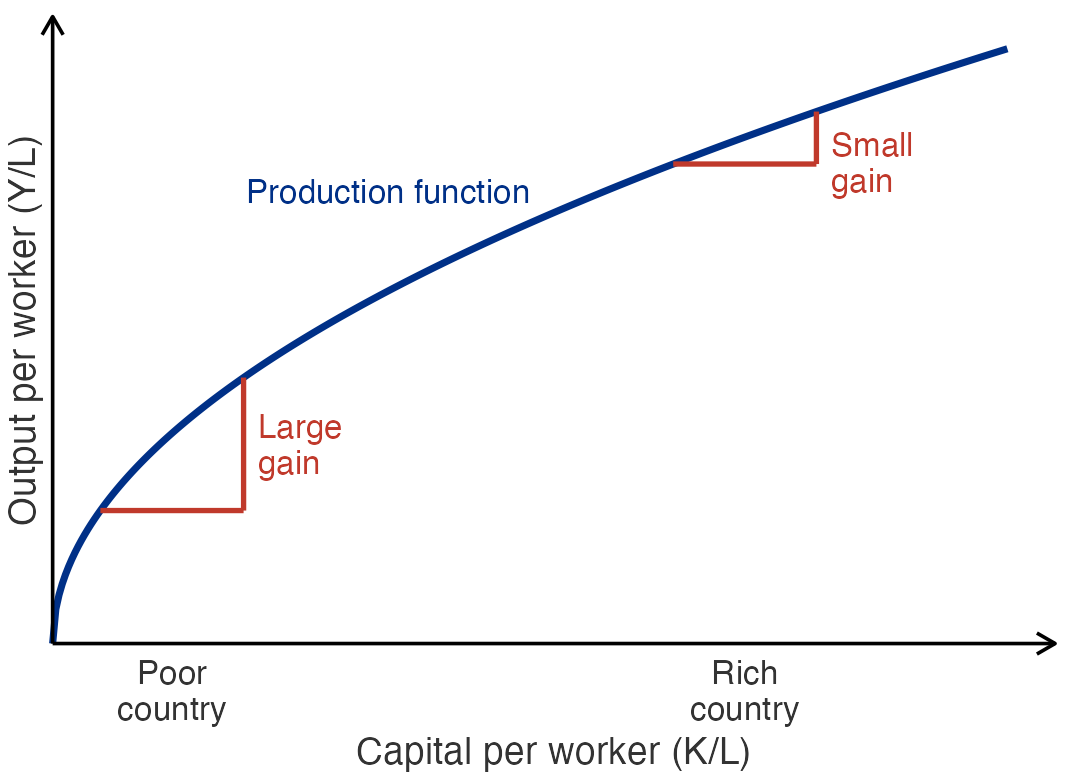
Diminishing Returns and the Catch-Up Effect
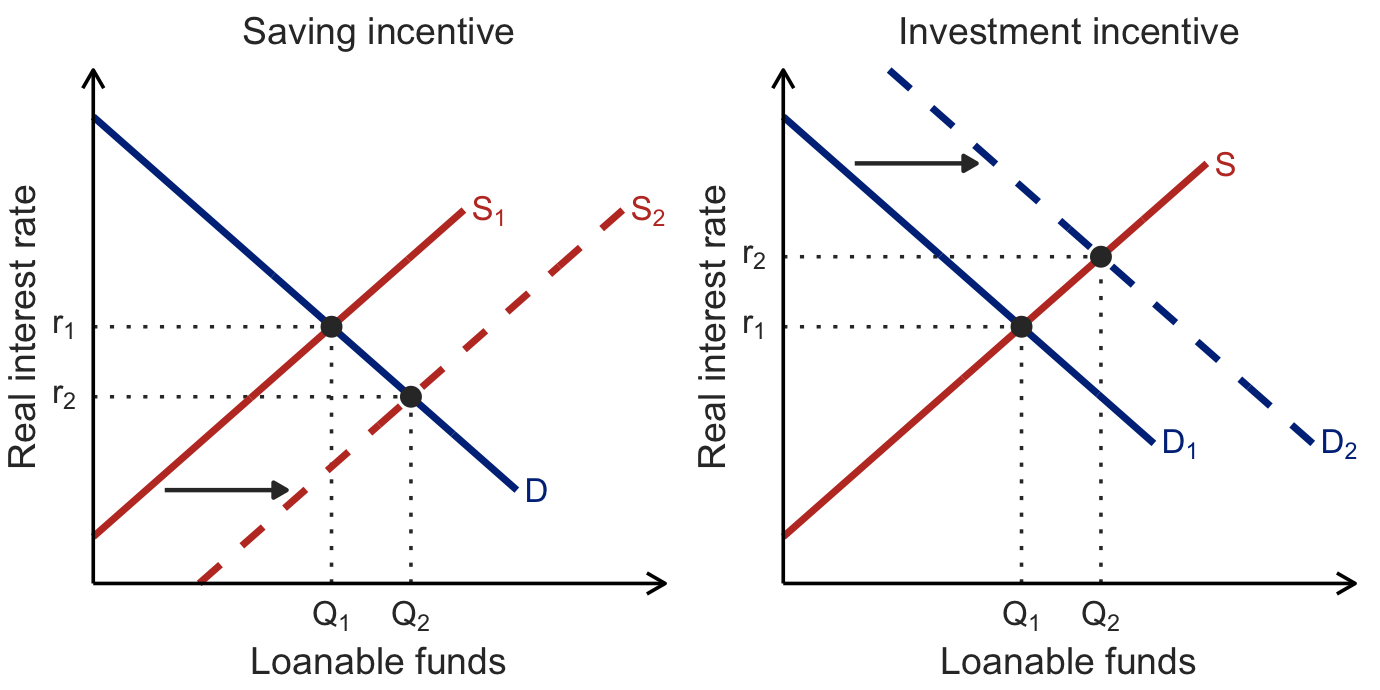
Loanable Funds: Saving and Investment Incentives
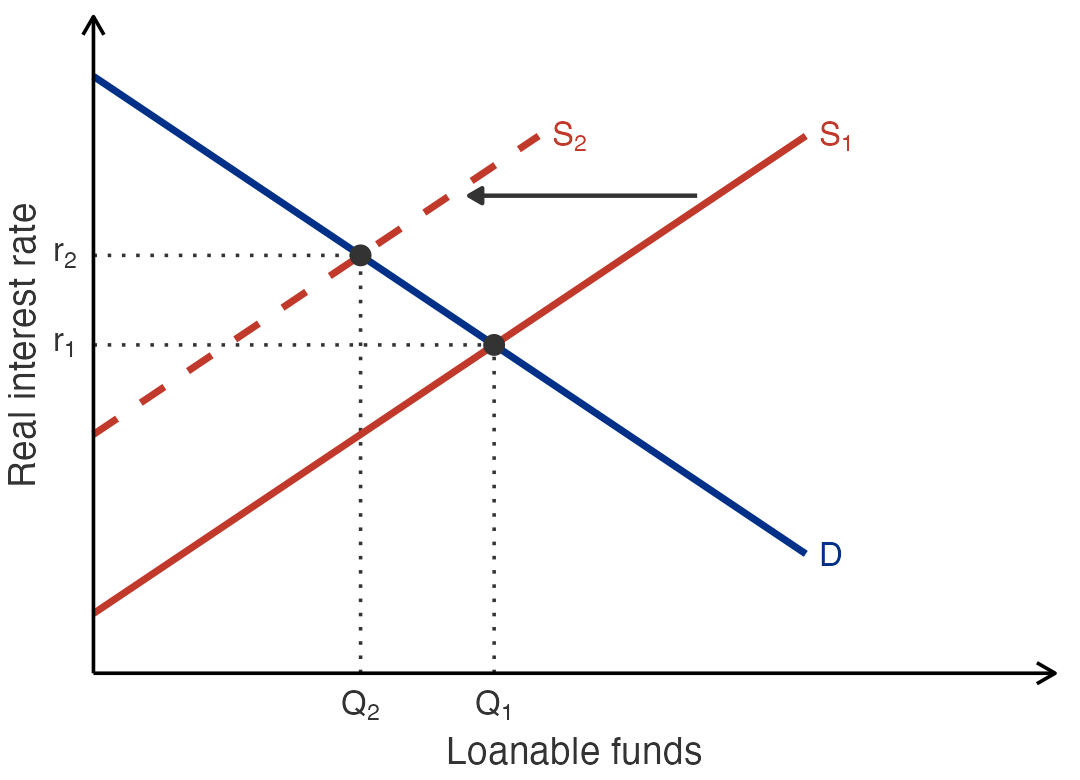
Loanable Funds: Government Budget Deficits
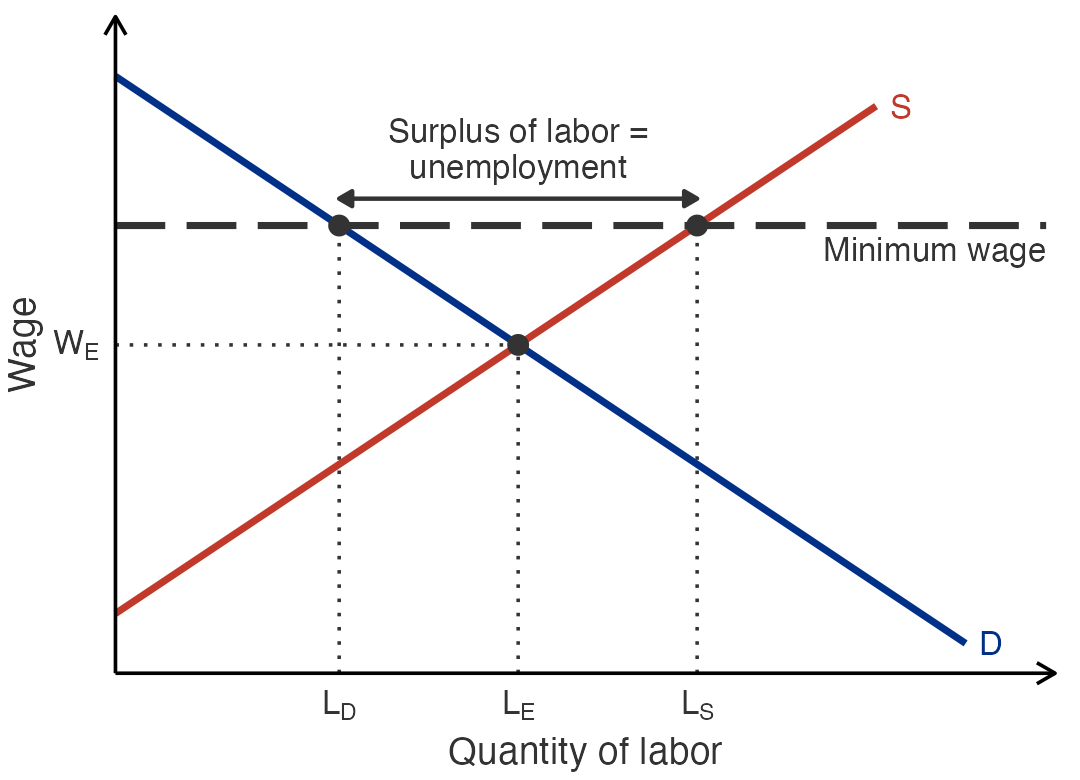
Unemployment From a Wage Above Equilibrium
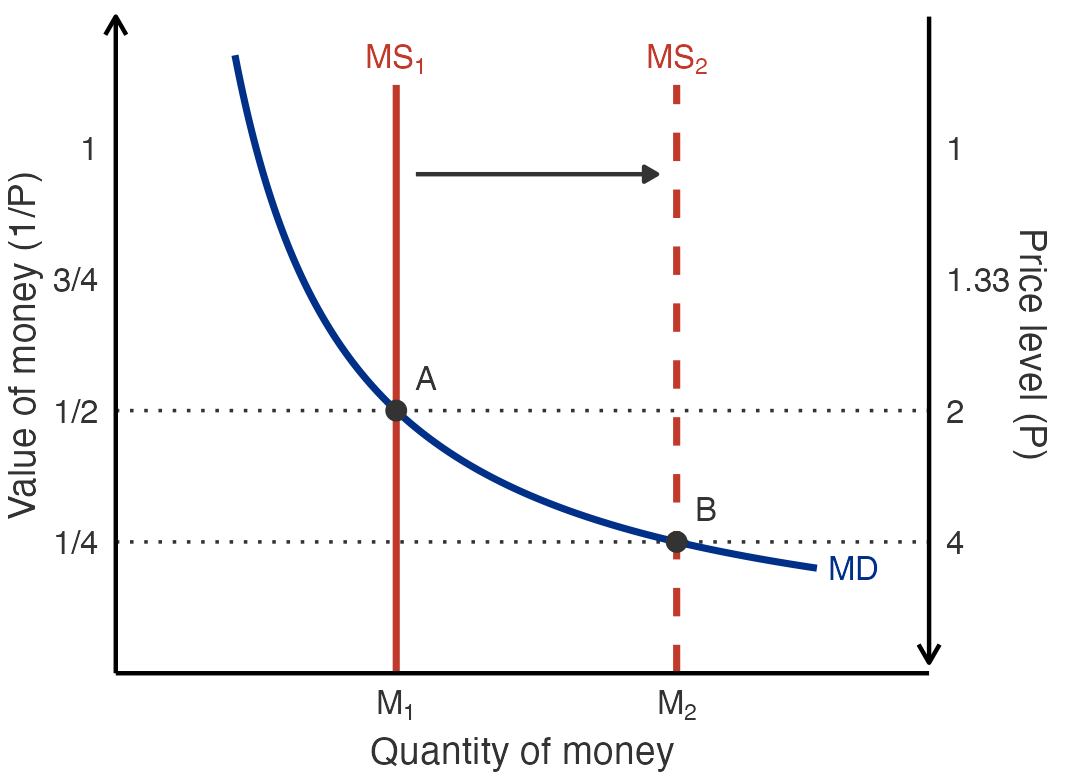
Money Supply, Money Demand, and the Price Level
Exam 3 Practice Questions
Chapter 24 Practice: Adding Up GDP
In one year, an economy has consumption of $8 trillion, investment of $2.5 trillion, government purchases of $3 trillion, exports of $1.5 trillion, and imports of $2 trillion. Compute net exports and GDP.
Answer: Net exports are \(\$1.5 - \$2 = -\$0.5\) trillion, and GDP is $13 trillion: \[Y = C + I + G + NX = 8 + 2.5 + 3 - 0.5 = 13\]
Chapter 24 Practice: What Counts Toward GDP?
Which of the following add to this year’s United States GDP?
- A new car built in Ohio and sold to a household
- A used car sold by one household to another
- A household’s purchase of a corporate bond
- A Social Security payment to a retiree
- A tractor built in Iowa and sold to a farm in Brazil
- Steel bought by an automaker to build cars sold this year
Answer: Only a and e. The new car is consumption and the tractor is an export. The used car was counted when it was new, the bond is a financial asset, the Social Security payment is a transfer, and the steel is an intermediate good already counted in the price of the cars.
Chapter 25 Practice: Computing the CPI
A typical household buys 10 coffees and 4 movie tickets each month. In the base year 2025, coffee costs $4 and a movie ticket costs $12. In 2026, coffee costs $5 and a movie ticket costs $13. Compute the CPI for 2026 and the inflation rate from 2025 to 2026.
Answer: The CPI is 115.91 and inflation is 15.91 percent. The basket costs \(10(\$4) + 4(\$12) = \$88\) in 2025 and \(10(\$5) + 4(\$13) = \$102\) in 2026: \[\text{CPI}_{2026} = \frac{102}{88} \times 100 = 115.91\]
Chapter 25 Practice: Real Interest Rates
A savings account pays a nominal interest rate of 6 percent while inflation is 4 percent. What is the real interest rate? What happens to the real interest rate if inflation rises to 7 percent and the nominal rate stays at 6 percent?
Answer: The real interest rate is \(6\% - 4\% = 2\%\). If inflation rises to 7 percent, the real rate falls to \(6\% - 7\% = -1\%\), so the purchasing power of the savings shrinks even though the account balance grows.
Chapter 26 Practice: Which Bakery Is More Productive?
Bakery A has 12 workers who each work 8 hours a day and together bake 480 loaves. Bakery B has 10 workers who each work 6 hours a day and together bake 360 loaves. Which bakery is more productive?
Answer: Bakery B. Productivity is output per hour of labor: \[\text{A} = \frac{480}{12 \times 8} = 5 \qquad \text{B} = \frac{360}{10 \times 6} = 6\] Bakery A bakes more loaves in total, but Bakery B bakes more per hour worked.
Chapter 26 Practice: The Catch-Up Effect
Country X has little capital per worker, and Country Y has a great deal. Both countries raise their saving rates by the same amount and invest the extra saving in new capital. Which country’s output grows faster in the years that follow, and why?
Answer: Country X. Capital is subject to diminishing returns, so an extra unit of capital raises output more when workers have little capital to begin with. This is the catch-up effect: countries that start out poor tend to grow faster than countries that start out rich.
Chapter 27 Practice: Saving in a Closed Economy
A closed economy has GDP of $20 trillion, consumption of $13 trillion, taxes of $3 trillion, and government purchases of $4 trillion. Compute private saving, public saving, national saving, and investment.
Answer: Private saving is \(Y - T - C = 20 - 3 - 13 = \$4\) trillion, and public saving is \(T - G = 3 - 4 = -\$1\) trillion. National saving is \(\$4 - \$1 = \$3\) trillion, and in a closed economy investment equals national saving, $3 trillion.
Chapter 27 Practice: A Tax Break for Savers
Congress reduces the tax on interest earned from savings accounts. Using the market for loanable funds, explain what happens to the equilibrium real interest rate and the quantity of investment.
Answer: Saving becomes more rewarding at every interest rate, so the supply of loanable funds shifts to the right. The equilibrium real interest rate falls, and the lower rate raises the quantity of loanable funds demanded, so investment rises. The demand curve does not shift.
Chapter 29 Practice: Measuring Unemployment
A country has an adult population of 250 million. Of these, 162 million are employed and 13 million are unemployed. Compute the labor force, the unemployment rate, and the labor-force participation rate.
Answer: The labor force is \(162 + 13 = 175\) million. \[\begin{aligned} \text{Unemployment rate} &= \frac{13}{175} \times 100 = 7.43\% \\ \text{Participation rate} &= \frac{175}{250} \times 100 = 70\% \end{aligned}\]
Chapter 29 Practice: A Binding Minimum Wage
The government sets a minimum wage above the equilibrium wage in the market for teenage workers. What happens to the quantity of labor supplied, the quantity of labor demanded, and unemployment? What type of unemployment results?
Answer: At the higher wage, more teenagers want to work and firms want to hire fewer of them, so the quantity of labor supplied exceeds the quantity demanded. The surplus of labor is unemployment. Because the wage is held above the level that balances supply and demand, this is structural unemployment.
Chapter 30 Practice: The Money Multiplier
The reserve requirement is 10 percent, banks hold no excess reserves, and people hold no currency. If the Federal Reserve buys $50 million of government bonds, by how much can the money supply increase?
Answer: By $500 million. The money multiplier is \(1/0.10 = 10\), and the purchase adds $50 million of new reserves: \[\Delta M = 10 \times \$50 \text{ million} = \$500 \text{ million}\]
Chapter 30 Practice: Excess Reserves
First National Bank has $200 million in deposits, $30 million in reserves, and $170 million in loans. The reserve requirement is 10 percent. How large are the bank’s excess reserves? If the bank lends out all of its excess reserves, by how much can the money supply of the banking system grow?
Answer: Required reserves are \(0.10 \times \$200 = \$20\) million, so excess reserves are \(\$30 - \$20 = \$10\) million. Lending out that $10 million can raise the money supply of the banking system by up to \(10 \times \$10 = \$100\) million.
Chapter 31 Practice: The Quantity Equation
An economy has a money supply of $4 trillion, velocity of 5, and real GDP of $10 trillion. Find the price level and nominal GDP. If the money supply then grows 6 percent and real GDP grows 2 percent while velocity stays constant, what is the inflation rate?
Answer: From \(M \times V = P \times Y\), the price level is \(P = (4 \times 5)/10 = 2\) and nominal GDP is \(P \times Y = \$20\) trillion. In growth rates, \(\%\Delta P = \%\Delta M - \%\Delta Y = 6\% - 2\% = 4\%\).
Chapter 31 Practice: The Fisher Effect
The real interest rate is 3 percent, and inflation rises from 2 percent to 5 percent. According to the Fisher effect, what happens to the nominal interest rate?
Answer: The nominal interest rate rises from \(3\% + 2\% = 5\%\) to \(3\% + 5\% = 8\%\). The Fisher effect says the nominal rate adjusts one for one with inflation, leaving the real interest rate unchanged.