ECON 672: Economics of Development
Week 1: What is development?
Course Logistics
Professor Introductions
Welcome to ECON 672 Economics of Development — I am looking forward to working with all of you this quarter!
A little bit about me:
Remy Beauregard, ’26 PhD in Economics from UC Davis
Experimental, behavioral, development economist
Research Associate at FRBSF ’19-’21
B.A. Econ and Psych Vassar College ’19
Grew up on the East Coast near Boston
Rock climb, hike, camp in beautiful California

Student Introductions
Please tell me a bit about yourself! In particular,
Your background before coming to USF
The origins of your interest in development economics
What you like to do outside of the Master’s program
Where you hope or plan to go after graduation
What you are excited to learn in this course
Syllabus Discussion
We will now go through our Canvas page and syllabus, including:
Class goals and outline
Required reading materials
Assignments and grading
Class expectations and policies
Any questions?
Structure of Lectures
This is my plan for our lecture time together, 105 minutes total:
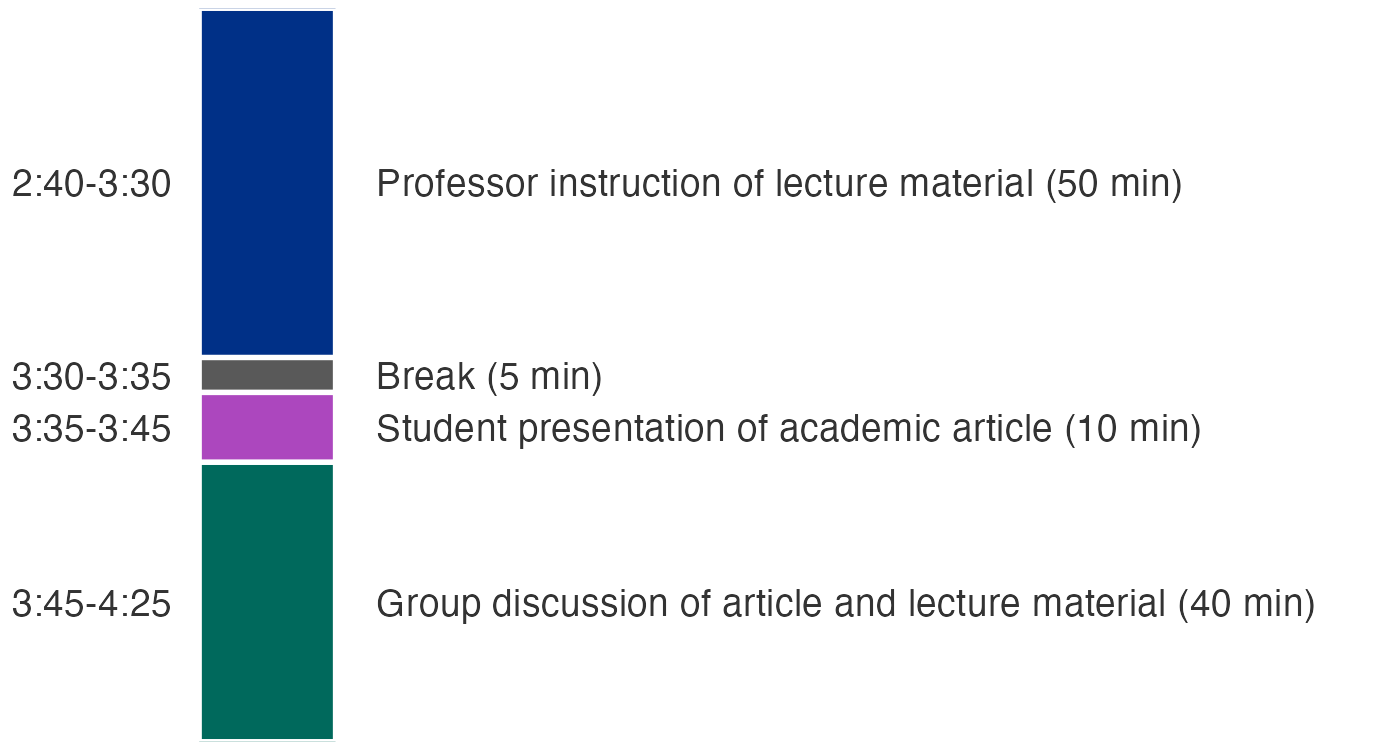
Questions and Participation
Of course, you are always welcome to ask questions at any point! My goal is to make this class a place where everyone feels comfortable learning, answering, and participating.
I will provide some suggested discussion questions for conversation in the latter part of class, but you should feel free to discuss any material outside of these as well.
Library Resources
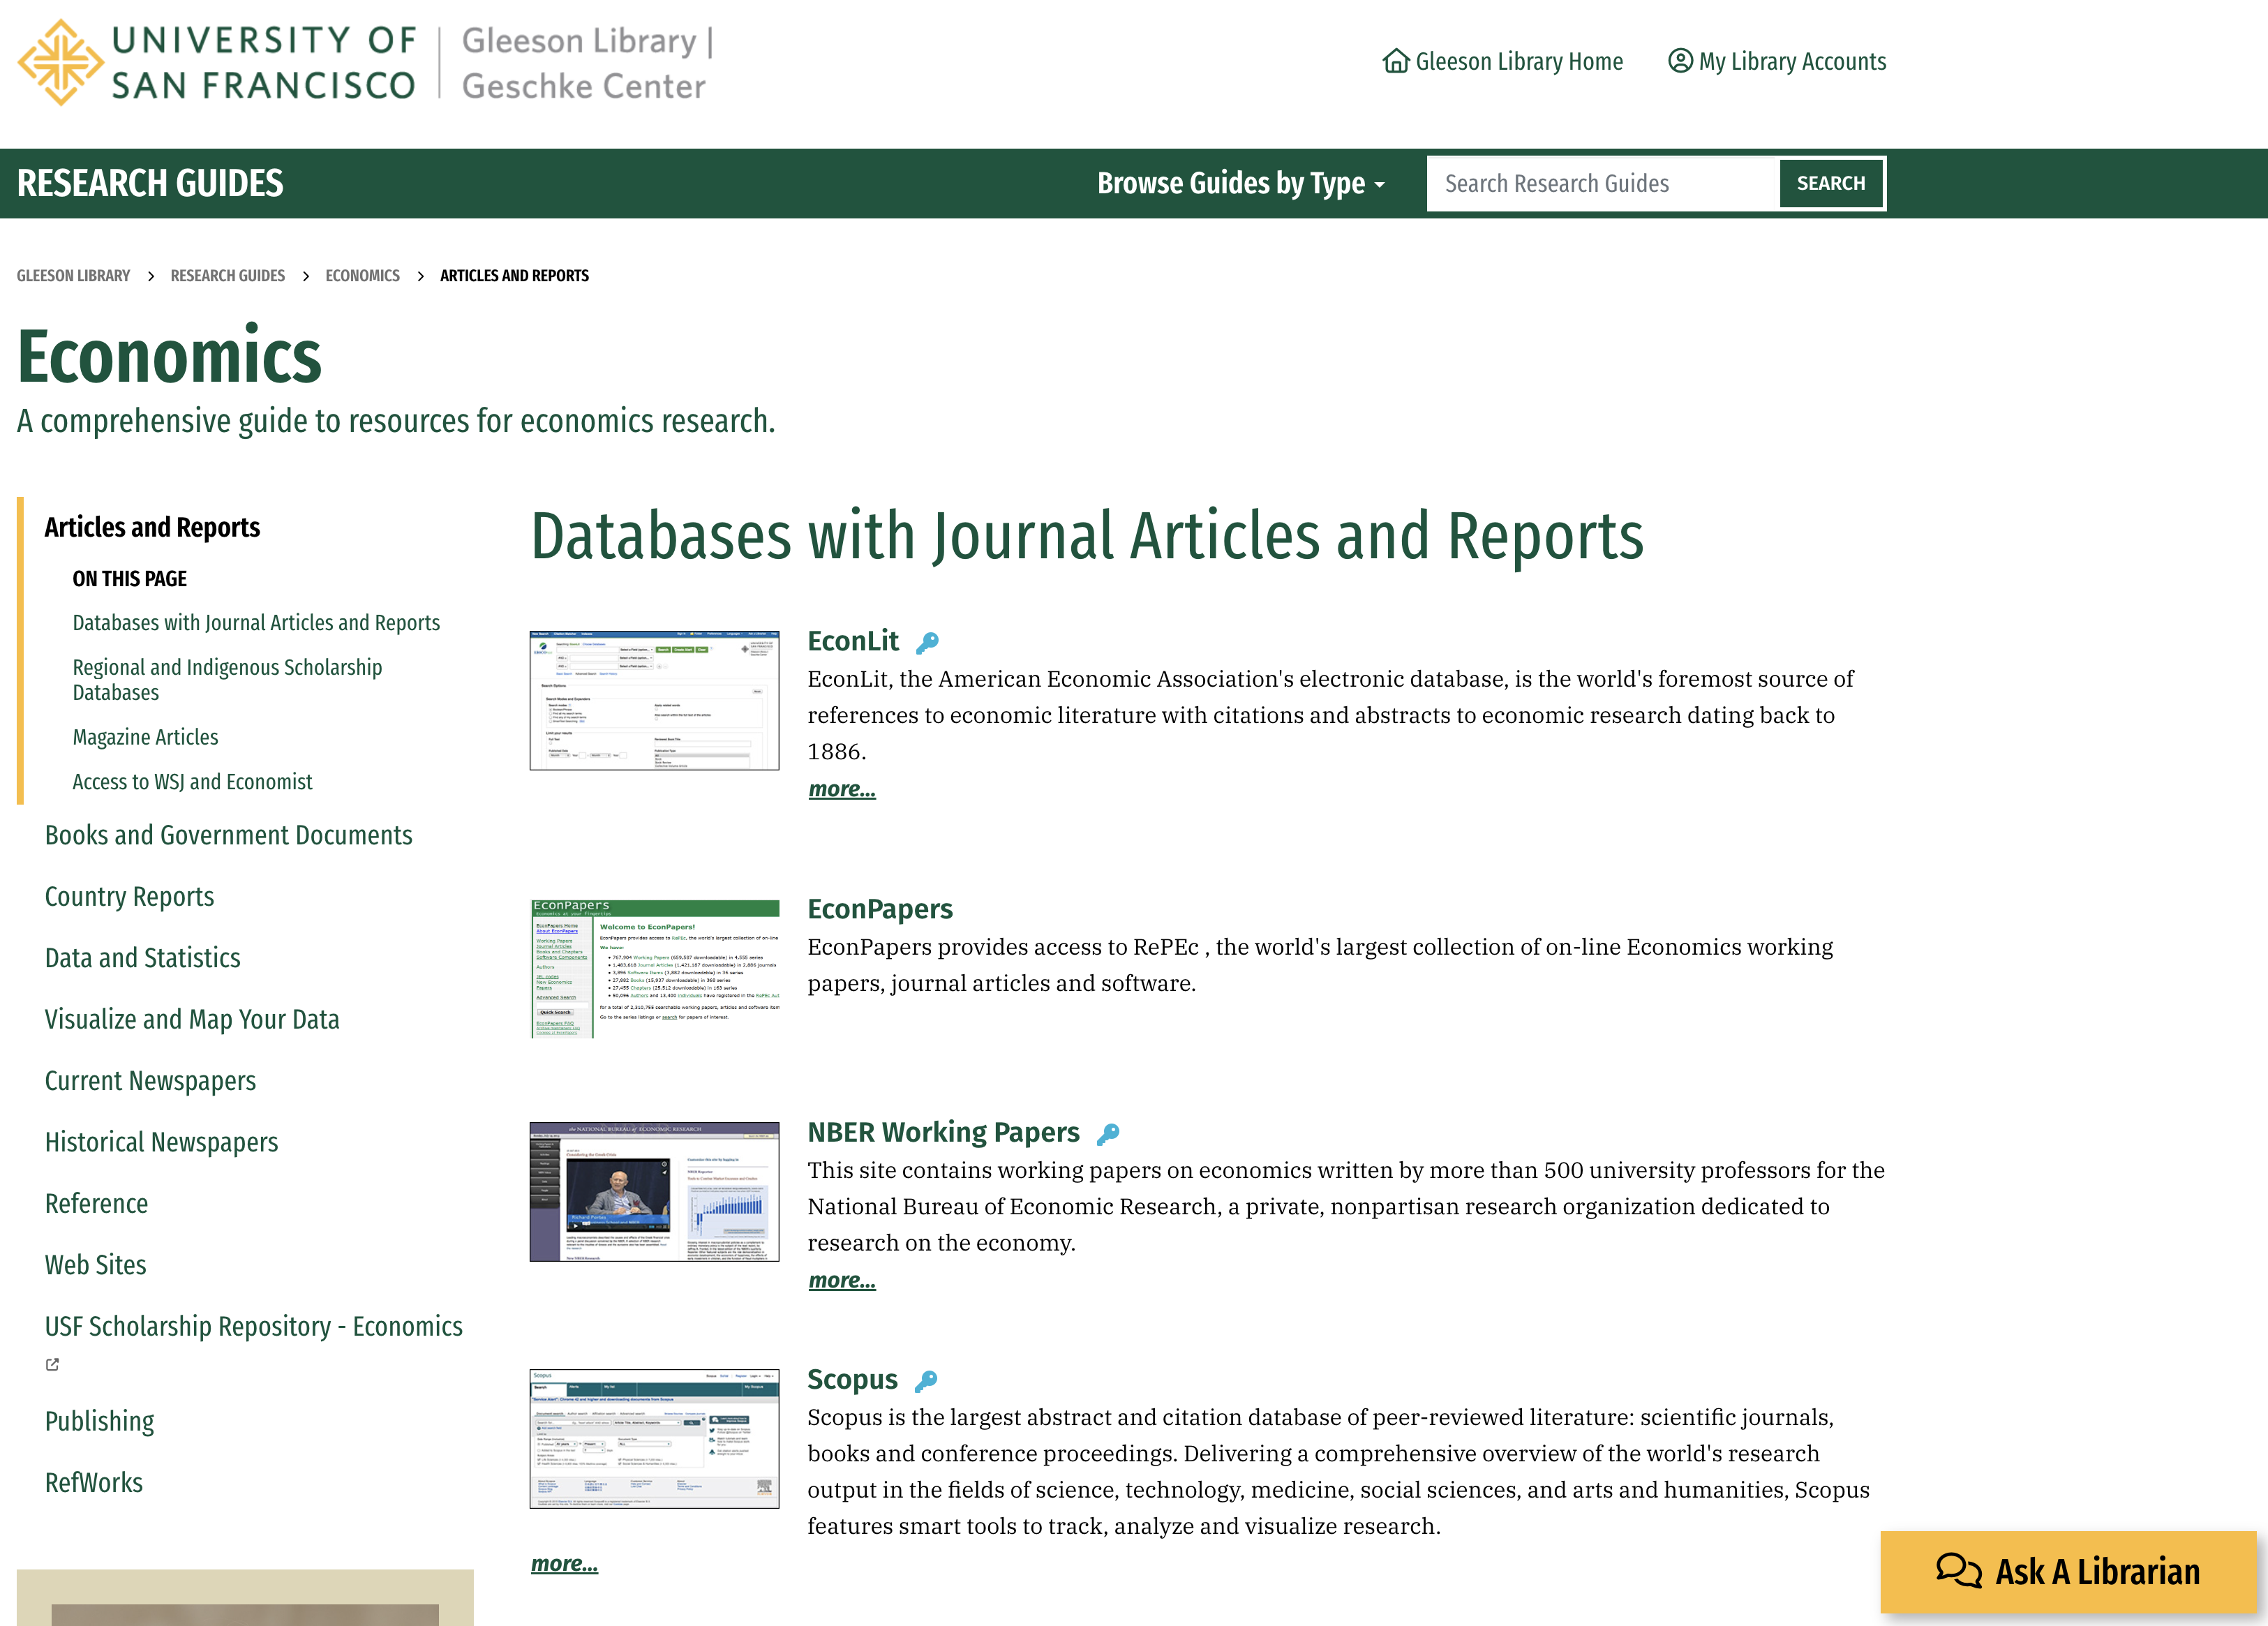
We have some incredible resources available from our library for all stages of research:
Make sure to attend department orientation for graduate Economics students scheduled for August 26 from 12-1pm via Zoom for a general overview of library services and resources
Our wonderful reference librarian Penny Scott, email: plscott@usfca.edu
Our library economics resource page for articles, reports, data, and more

Reading Strategically in ECON 672
Between our textbook, Poor Economics, and our assigned journal article, each week of this class involves a significant amount of reading. This is intentional, as our subject is dense, multifaceted, debated, and continuously evolving. However, you may find the volume of material exceeds your temporal constraint in a given week.
My recommendation is to identify the high-impact or big-picture areas of our texts: what is the main point they are trying to convey? What question are they asking, and how are they answering it? I am less concerned that you know the minute details of the econometric method than that you take away the big idea. We will also cover the most important elements from each textbook chapter during lecture, but some familiarity ahead of time is valuable.
Of course, a career in development economics is long. I often find myself returning to papers I have read before for new insights and inspiration. I recommend keeping notes for yourself, either annotated on the document or kept separately; these may be very helpful in the future!
Lecture Material
What is Development Economics?
We will begin our investigation with a paradox: most people agree that “development” is important but what does it mean?
What is development economics? How do we identify problems and their solutions? How do we choose which interventions to explore, fund, or scale? How do we ensure these interventions actually make people’s lives better? How should we consider trade-offs?
The Scale of Global Poverty
As of 2025, roughly one in ten people worldwide, some 831 million, live in extreme poverty on less than (PPP)$3.00/day. About 3.7 billion, roughly 45% of the world’s population, live on less than (PPP)$8.30/day, the line more relevant to UMICs. Poverty is also concentrated: nearly three quarters of those in extreme poverty live in rural areas, and 71% live in Sub-Saharan Africa.1
About 83% of the world’s population, some 6.8 billion of 8.2 billion people, lives in a developing country.2
What are the lives of these households like and how should their standard of living be raised? What does it mean to live a better life?
Measuring Wellbeing
Wellbeing is multidimensional! How should we measure it?
Seven Horsemen of Underdevelopment as our roadmap:
low levels and growth of national income per capita (GNIpc)
extensive material poverty, food insecurity, and hunger
inequality in income and opportunity
vulnerability to shocks and poverty traps
lack of basic needs including health and education
scarcity of natural resources and environmental stress
low quality of life (Sen, 1985) from human rights and freedoms
Growth and Convergence
GNI3 growth primacy: a rising tide should lift all boats (compared to purely redistributive policy), but does it?
How is growth distributed among the population? Is it sustainable? What are its costs?
We observe uneven convergence of growth between developing countries: some appear to be catching up while others lag behind. What explains these differences?
Is income wellbeing? Life satisfaction rises with log GDPpc across countries but falls with its growth rate; health satisfaction has a much weaker positive relationship (Deaton, 2008)
Explaining Uneven Convergence
Some explanations for this uneven convergence include:
Geography and factor endowments (Diamond; Sachs & Warner)
Institutions (Acemoglu & Robinson)
Government policy (Romer, Rodrik)
Cultural norms (Weber)
There is fierce debate among economists (and others) about the relative importance of these factors. Additionally, we might consider the problem of development from either a macro (country-level) or micro (household-level) perspective.
From Ideology to Evidence
Rigorous impact analyses should as much as possible be used to assess what matters for growth and convergence, turning the debate from one of personalities and ideologies to one of data and quality of analytics, a point effectively argued by Banerjee and Duflo (2011) that is central to the approach followed in this book.
— de Janvry & Sadoulet, p. 6
Where Should Policy Be Injected?
Where should policy be injected?
Iron triangle of development including:
Market and private sector policy (e.g. Chile)
Direct state intervention policy (e.g. China)
Civil society organization (e.g. Japan)
Effective policy requires coordination, information, and balance! We will also think about failures of markets, states, and civil societies and how these affect development.
Competing Perspectives
Books with differing development economics perspectives:
Poor Economics, Banerjee & Duflo (2025 revision): micro-founded trial and error of RCTs
The Bottom Billion, Collier (2007): political stability and conventional macro policy
Why Nations Fail, Acemoglu & Robinson (2012): property rights, rule of law
The End of Poverty, Sachs (2005): foreign aid from rich countries
One Economics, Many Recipes, Rodrik (2007): context-specific, unconventional policy
… and more!
Causality over Correlation
A brief note on econometrics:
To design good policy, we ought to establish causality over correlation: evidence that \(X\) causes \(Y\) to change: \[Y=f(X,E)\]
\(Y\): outcome we care about
\(X\): intervention we are testing
\(E\): environmental factors we cannot control
\(f()\): some functional form we will model and estimate
Strategies for Causal Identification
To achieve causal estimates, we can:
Find naturally occurring random experiments or natural experiments
Randomize units of observation into treatment and control ourselves in randomized controlled trials or RCTs
Find an instrument for our \(X\) variable of interest
RCTs are often very expensive and time-consuming and good instruments/natural experiments are rare. Why work so hard?
“I gave all farmers in the village a subsidy and crop yields increased 50%” vs. “I randomly assigned all farmers in 15 villages a subsidy and all farmers in another 15 villages no subsidy, and crop yields for the treated villages increased 50% relative to control” — in which are you more likely to invest as a policymaker?
Growth Accounting
A brief note on growth accounting:
We compute GDP as \(GDP=C+I+G+(X-M)\) and GDPpc as \(GDPpc=GDP/N\) where \(N\) is the population. We may use \(Y\) to represent GDP, \(y\) to represent GDPpc, and \(t\) to represent time.
We compute the average annual growth rate of GDPpc as: \[\bar{g}_y=(y_T/y_0)^{1/T}-1\] where \(T\) is the number of years between the two observations.
We could also predict growth \(h\) years into the future: \[y_{T+h}=y_T(1+\bar{g}_y)^h\]
Growth Accounting: Three Adjustments
Three adjustments:
- Growth rates may not be constant over time, so we may want to compute a growth rate for each year and then average them. The textbook demonstrates how we could estimate this using time series data and least squares regression.
- GDP/GNI growth does not account for changes in prices. We differentiate between real and nominal GDP/GNI, where the former is adjusted for inflation and the latter is not. Generally, we can compute \(g_{y_{real}}\approx g_{y_{nominal}} - g_{prices}\).
- Different countries both use different currencies and have different price levels. To compare buying power accurately across countries, we typically use Purchasing Power Parity or PPP-adjusted GDPpc US dollars: what can the money we have actually buy?
Growth Accounting: Two Caveats
Two caveats:
- GDP/GNI will miss unpriced contributions or costs to the economy, such as unpaid work or externalities. We may want to instead consider a more holistic Genuine Progress Indicator or GPI measure that assigns these a monetary value, although this is very challenging to compute. Other measures of wellbeing include the Human Development Index or HDI, which combines GNIpc with life expectancy and education, and the Multidimensional Poverty Index or MPI, which combines health, education, and living standards.
- GDP/GNI also uses an average of earnings rather than the median, meaning it will miss issues of income inequality. For the US, we observe that average incomes rose much faster than median incomes between 1984–2006.
Economic Development vs. Development Economics
Economic development vs. Development economics: what has worked before vs. what will work in the future?
Diagnostics, causalities, design, implementation, experimentation, and assessment is our agenda in learning to think development.
— de Janvry & Sadoulet, p. 13
Tools of the Trade
What types of tools do we need?
Economic theory (macro and micro)
Trade and international
Labor, health, migration, gender, IO
Environmental, resource, and climate
Game theory
Psychology and behavior
Econometrics
Experimental design
Positive and Normative Questions
What can we learn?
Positive economics: what is, what has been, what will be
Normative economics: what should be, what could be
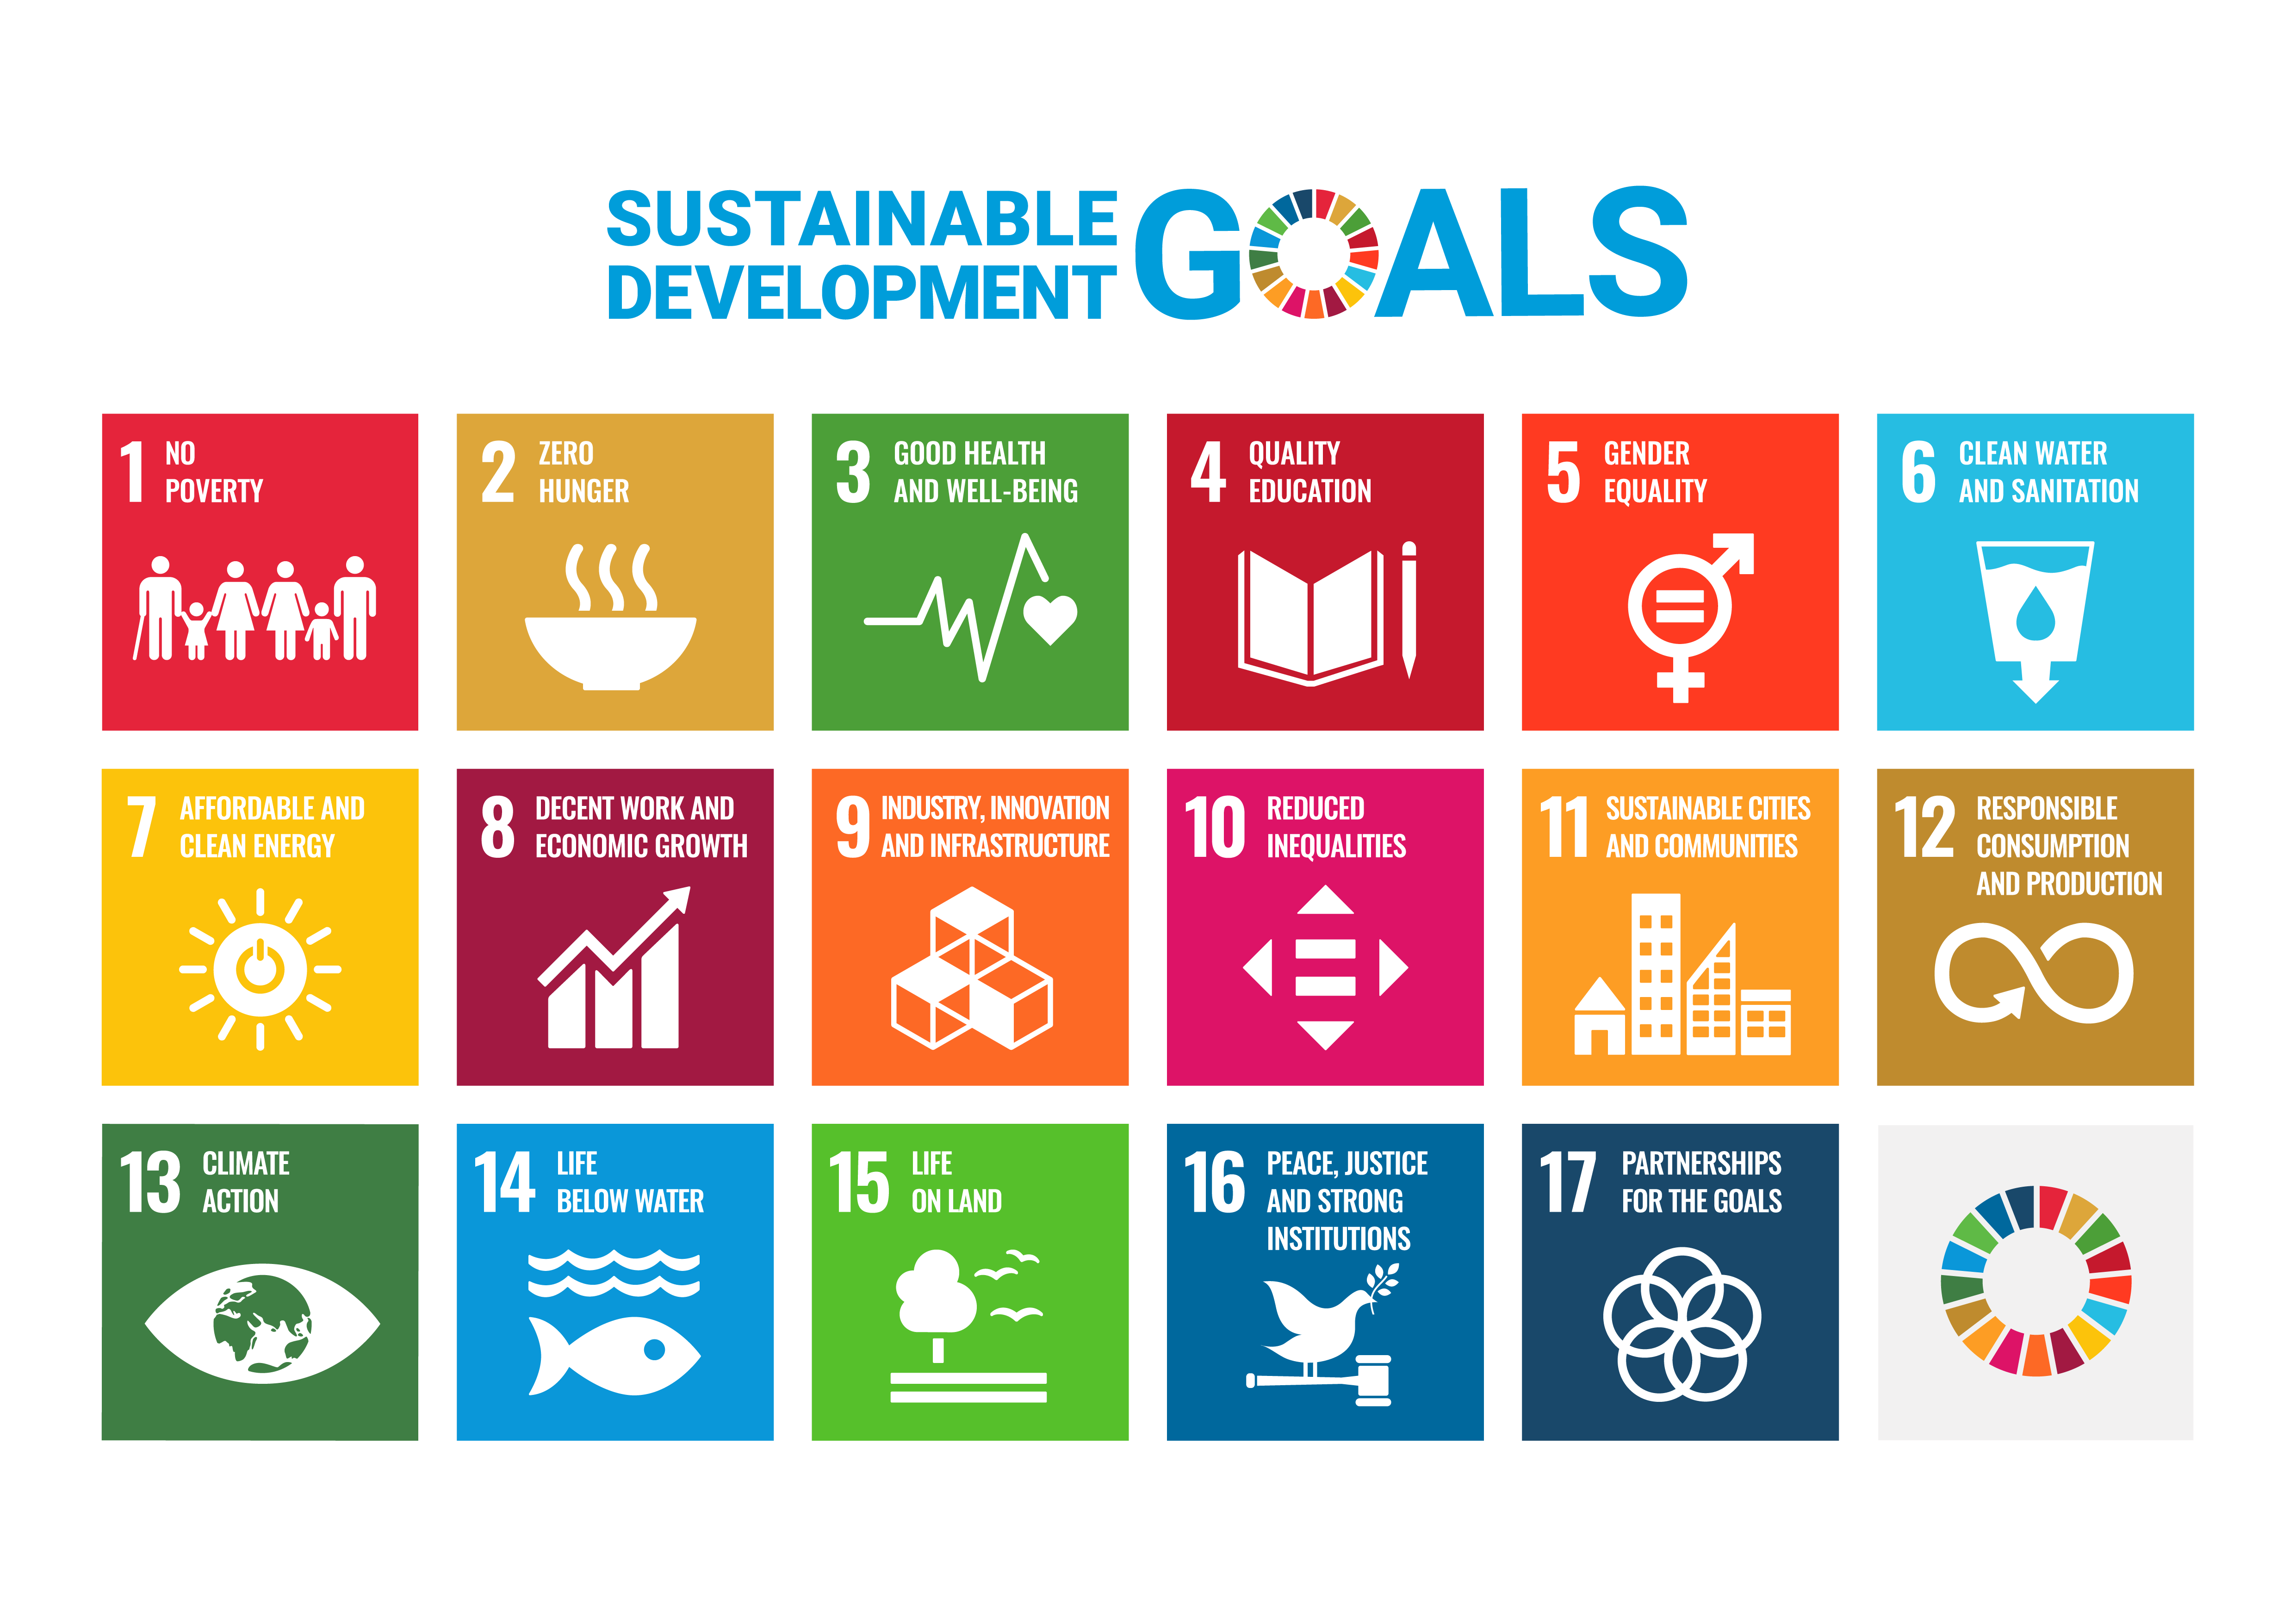
The United Nations’ eight Millennium Development Goals (MDGs) set targets to be met by 2015 and were succeeded by the 17 Sustainable Development Goals (SDGs) for 2030. Results for the former were mixed, with both failures and unintended consequences. The new goals more strongly emphasized both environmental issues and the achievement process.
These SDGs include action on poverty, hunger, health, education, gender equality, water, energy, work, innovation, inequality, communities, consumption, climate, oceans, land, peace, and global partnerships.
Sustainable Development Goals
Equality and Equity
While the SDGs discuss reducing inequality, we could also think about targeting inequity. The former is an ex-post measure (e.g. how do workers’ wages differ?), while the latter is an ex-ante measure (e.g. how do workers’ opportunities to get hired differ?).
The two need not always move together: workers of one group may be much less likely than those of another group to be hired, but once hired earn similar wages. Conversely, the two groups may be equally likely to be hired, but one group may earn significantly more than the other once hired.
5-minute Break
Presentation of Academic Article
Typically, I would randomly select one student to present their Weekly Reading Response on our assigned academic journal article.
For today, however, I will offer a presentation of our first article, “The Economic Lives of the Poor” by Banerjee & Duflo, JEP 2007.
These presentations should be roughly 5-8 minutes and answer all five major questions from our reading response guidelines:
What is the research question?
How do the authors answer it?
What do they find?
Are you convinced by the design and results?
How does the paper connect to our other readings?
Banerjee & Duflo (2007): Question and Data
- The paper explores the multidimensional lives of the “extremely poor” in developing countries, defined as those living on (consuming) less than $1.08/day, and the “poor”, those living on less than $2.16/day (PPP). The authors aim to understand how these households make economic decisions, what constraints they face, and how they manage risk and uncertainty.
- The paper uses publicly available household surveys (Living Standards Measurement Surveys from the World Bank and Family Life Surveys from Rand) from 12 developing countries: Côte d’Ivoire, Guatemala, Indonesia, Mexico, Nicaragua, Pakistan, Panama, Papua New Guinea, Peru, South Africa, Tanzania, and Timor-Leste. The authors add primary data collection in India, for 13 countries in total, to offer descriptive summary statistics of household demographics and economic behavior.
Banerjee & Duflo (2007): Findings and Assessment
- Poor and extremely poor households tend to be large, with ages skewing younger. Poor households spend money on purchases other than more calories (despite deficits), including tobacco, alcohol, festivals, TVs, and radios, and many own land. Many households own (several) businesses and invest little in (free) education. Poor households have poor physical health and high stress, lack access to cheap formal credit or insurance, and appear not to permanently migrate to greater opportunity.
- As the authors discuss, measuring poverty systematically is not easy, and consumption data may not give the whole picture of intended or representative economic behavior. While their results are observational and descriptive (not causal), they offer an important snapshot of life as it is lived. The authors make choices about how to measure their outcomes of interest (and which outcomes to consider); different economists may have made different choices.
Banerjee & Duflo (2007): Connections
- The paper helps us begin our investigation of development economics and its goals by giving context to the lives of poor households in developing countries. Contrary to theoretical assumptions about behavior, poor households exhibit (un)surprising systematic behaviors that we should consider when designing policy. These results will be used to design future RCTs we will discuss later, including many by these same authors. The paper highlights a central problem with our accounting of wellbeing: what importance or weight should we apply to various features of life? Just because a doctor recommends eating more calories, would a household be happy giving up spending on festivals or alcohol? We observe a disconnect between a normative view (what should households do) and a positive one (what do households do).
Group Discussion
Bringing together our lecture material and academic article, I have prepared the following suggested discussion questions:
How would you define development economics? How should it be measured? Where might economists and households disagree?
How would you characterize our current moment of economic development? Where do you think we are heading?
What areas of development do you think are most critical to address going forward? Why?
What are some different approaches taken to deliver economic development? What are their trade-offs?
Is there something you feel development economics is missing?
Roadmap
Looking Ahead to Week 2
What do we have on the horizon before next Tuesday?
Our Interest Survey assignment will be due on Friday at 6pm to begin identifying viable topics for the class research project
My office hours for ECON 672 will be held Tuesdays before class, 12:15-2:15pm in MCL 108 or virtually by appointment
Our second topic will be The state of development: growth and cross-country income differences. Our textbook reading will be Chapter 2 and Chapter 8, pp. 219-230. Our required journal article will be Acemoglu, Johnson, & Robinson (2001), “The Colonial Origins of Comparative Development,” AER.
Our Weekly Reading Response assignment for this paper will be due Tuesday at 2:40pm before class. One student will be randomly selected to present their response to the class in 5-8 minutes, as I did today.
Footnotes
World Bank Group, Poverty & Inequality Update, October 2025. These lines are more recent than our textbook’s, which uses PPP$1.90 and PPP$5.50.↩︎
World Bank WDI, 2025. Developing country: low- or middle-income (LMIC), 2025 GNI per capita at or below $14,375.↩︎
“GNI is the sum of gross domestic product (GDP; the aggregate of value-added by all firms in the country) and net factor incomes from abroad (under the form of repatriated profits and remittances sent by migrants).” — de Janvry & Sadoulet, p. 23↩︎