ECON 672: Economics of Development
Week 6: Poverty, vulnerability, and poverty traps
Measuring Poverty
Elements of studying poverty: \[ \left.\begin{array}{l} \text{Monetary indicator of wellbeing} \\ \text{Threshold level for this indicator} \end{array}\right\}\ \text{Poverty indicator measure} \]
We might also consider different types of poverty, e.g. chronic vs. transitional
Monetary Indicators of Wellbeing
Monetary indicators:
- income (means); many sources and destinations
- consumption (end); reporting errors and necessary adjustments
Pattern of consumption smoothing observed in bad times, in youth, and old age, means income would likely overstate true volatility of wellbeing.
Adult-equivalent household size \(n^*\): \[n^*=\sum_kw_kn_k\] with weights \(w_k\) and numbers of individuals \(n_k\) for \(k\in K\)
Weights can be empirically estimated using data on household composition and consumption.
Data for Measuring Poverty
Measuring poverty over time is data intensive:
- Living Standards Measurement Study (LSMS)
- Household income and expenditure studies
- Population censuses
- Employment and wage surveys
- Field experiments with dietary reports or blood tests
Poverty Lines and Poverty Measures
Construction of poverty line and relative poverty:
- Nutrition-based line, minimum recommended 1,800 kcal/day/adult
- International poverty line set by World Bank (PPP dollars per day)
- Relative poverty line for dignified social participation
- Weakly relative poverty line, as line rises with GDPpc
Headcount ratio gives how many people live in poverty, relative to the population, for a choice of poverty line.
We could also compute the poverty gap index for the total amount necessary to transition all out of poverty, relative to the threshold. We could also employ quadratic methods to put more weight on extreme poverty than moderate poverty (de Janvry & Sadoulet, p. 148).
The Dynamics of Poverty
We should also consider the dynamics of poverty:
- Transitional/temporary poor (rarely below)
- Chronic poor (often below)
- Persistent poor (always below)
- Never poor (never below)
The first group often far outnumbers the third group, such that we may wish to decompose the headcount ratio for better policy.
Vulnerability to Poverty
We also consider poverty vulnerability due to shocks
- Estimate \(\widehat{\Pr}[\text{poor next year}\mid\text{Characteristics}]\)
- Estimate SD \(\sigma_{y_{i,t+1}}\)
- Requires panel data to estimate
- Estimates vulnerable to measurement error
We might also consider marginal households above but not far above the poverty line, those who are not poor but may be pushed into poverty, to calculate a vulnerability rate.
Impact evaluation on causal impacts of short-run shocks on long-run development outcomes is growing.
Poverty Traps
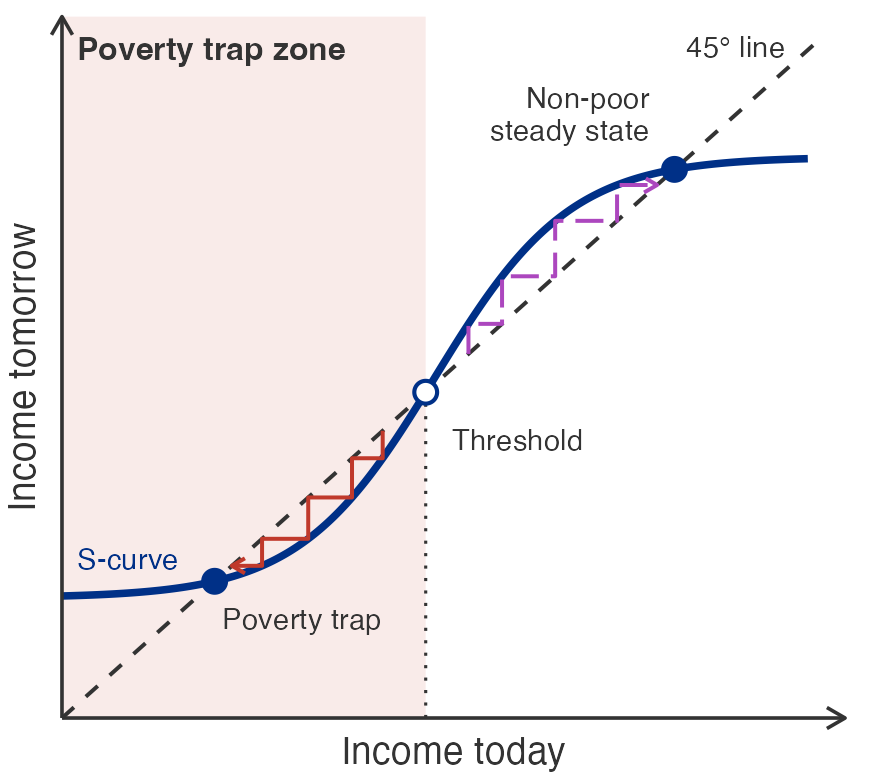
Some shocks may be irreversible and lead to poverty traps: inescapable “vicious cycle” downward into chronic or permanent poverty.
\(\Rightarrow\) If such an “event horizon” for poverty exists, we should aim policy squarely at raising and keeping households above this line, perhaps with a “big push”.
Poverty Traps: The S-Curve
Kraay & McKenzie on Poverty Traps
Even almost 60 years ago, the idea of poverty traps was so well-established in the thinking of the profession that Nelson [1956] felt obliged to acknowledge in his introduction: “Although the notion of low-level stagnation is scarcely new or different, it is hoped that this paper does more than express the common knowledge of economists in a complicated manner.” But what does the modern evidence suggest on the extent to which poverty traps exist in practice and what underlying mechanisms they might involve?
— Kraay & McKenzie, 2014
Economic Mobility
Alternatively, we might consider economic mobility, transition profiles of households across time across income quintiles, and intergenerational poverty, how (lack of) wealth is carried from one generation to another.
For example, a household that began in the poorest fifth of households and ended up in the richest fifth would have high upward mobility. Raj Chetty’s work on “Moving to Opportunity” considers this for neighborhoods in the U.S.
Behavioral Poverty Traps
We might also consider behavioral poverty traps, behaviors induced by poverty that prolong or deepen poverty:
- Cognitive impairment from poverty (Mullainathan & Shafir, 2013); “scarcity captures the mind”
- Vicious cycle between poverty and poor mental health (Haushofer and others); monetary and/or non-monetary interventions to improve mental health and reduce poverty
Work as welfare? Workfare?
\(\Rightarrow\) Benefits on the Bench: Workfare, Mental Health, and the Role of the Team with Carlos Brito, CIDE
Poverty Alleviation Programs
Economics has also begun to explore other avenues of poverty alleviation:
- Conditional and unconditional cash transfers ([C]CTs)
- Mental health and psychological interventions
- Paired economic and non-economic interventions
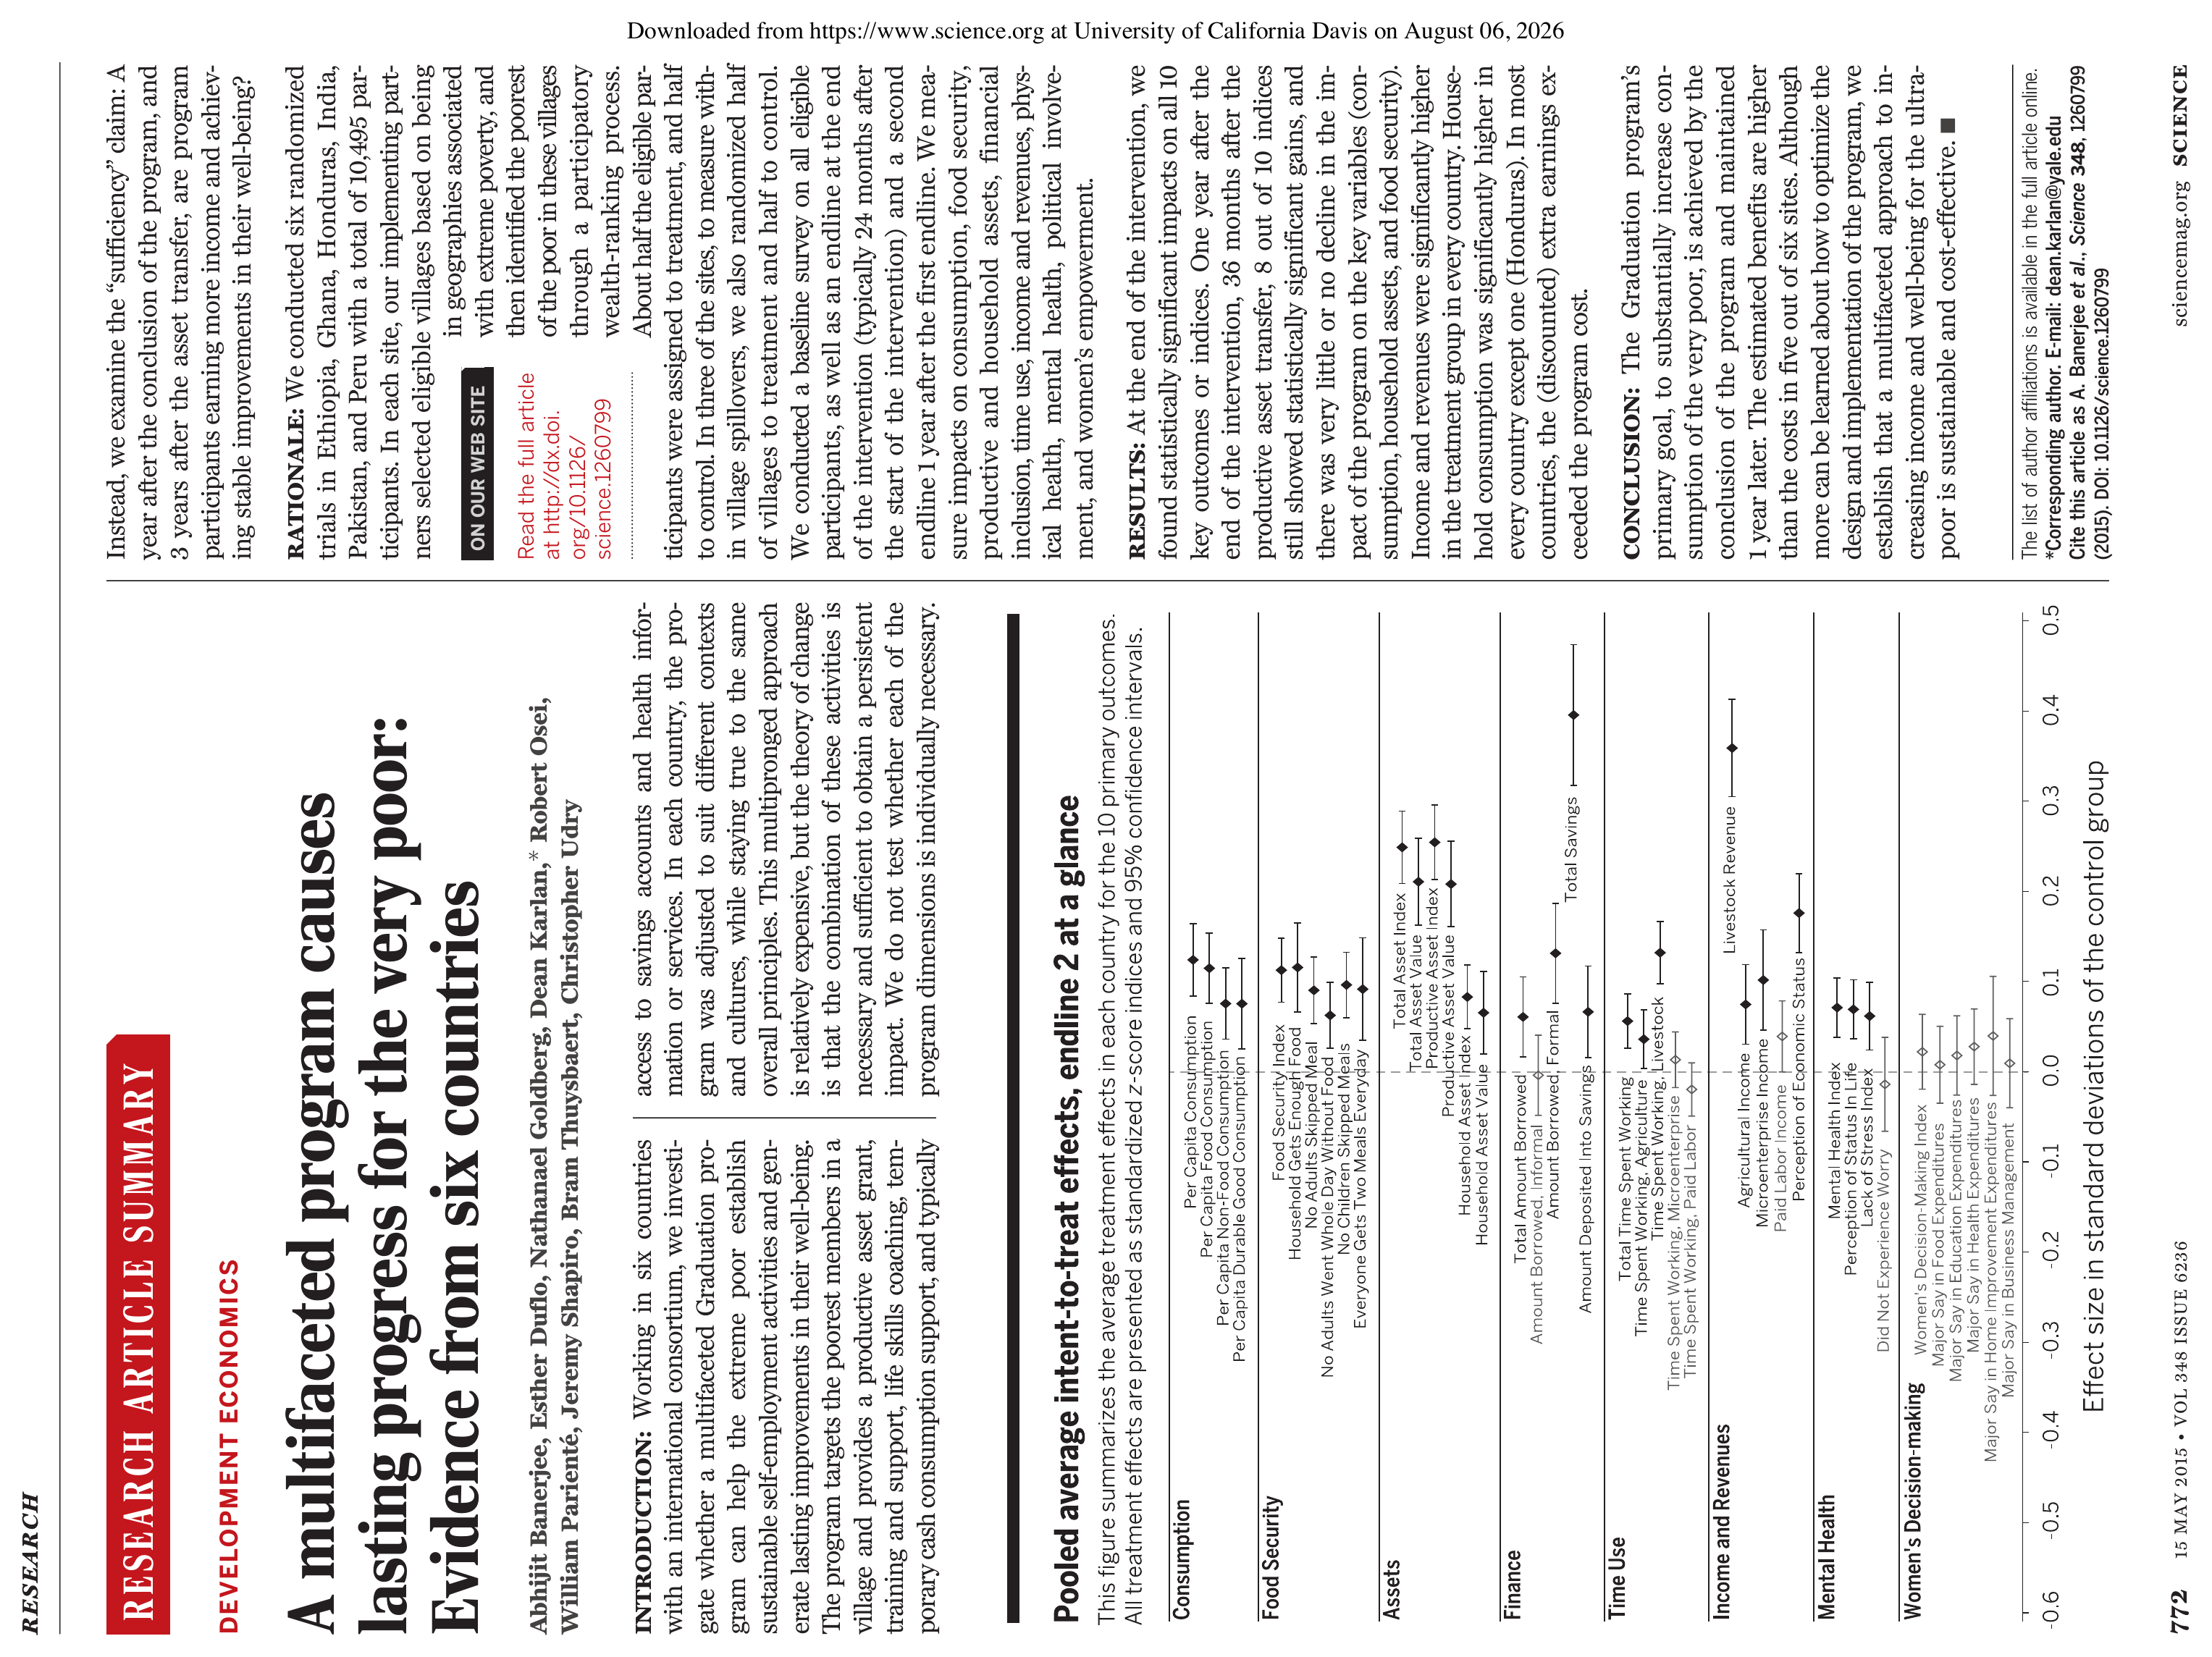
- Graduation programs (Banerjee et al., 2015)
Revisiting Banerjee & Duflo (2007)
Let us revisit our article from Week 1, “The Economic Lives of the Poor” by Banerjee & Duflo, JEP 2007. This informs much of the discussion in Poor Economics Chapter 2 [and thus Kraay & McKenzie and deJanvry & Sadoulet] by giving a profile of the poor and extremely poor.
Banerjee & Duflo (2007): Question and Data
The paper explores the multidimensional lives of the “extremely poor” in developing countries, defined as those living on (consuming) less than $1.08/day, and the “poor”, those living on less than $2.16/day (1993 PPP). The authors aim to understand how these households make economic decisions, what constraints they face, and how they manage risk and uncertainty.
The paper uses publicly available household surveys (Living Standards Measurement Surveys from the World Bank and Family Life Surveys from Rand) from 12 developing countries: Côte d’Ivoire, Guatemala, Indonesia, Mexico, Nicaragua, Pakistan, Panama, Papua New Guinea, Peru, South Africa, Tanzania, and Timor-Leste. The authors add primary data collection in India, for 13 countries in total, to offer descriptive summary statistics of household demographics and economic behavior.
Banerjee & Duflo (2007): Findings and Assessment
Poor and extremely poor households tend to be large, with ages skewing younger. Poor households spend money on purchases other than more calories (despite deficits), including tobacco, alcohol, festivals, TVs, and radios, and many own land. Many households own (several) businesses and invest little in (free) education. Poor households have poor physical health and high stress, lack access to cheap formal credit or insurance, and appear not to permanently migrate to greater opportunity.
As the authors discuss, measuring poverty systematically is not easy, and consumption data may not give the whole picture of intended or representative economic behavior. While their results are observational and descriptive (not causal), they offer an important snapshot of life as it is lived. The authors make choices about how to measure their outcomes of interest (and which outcomes to consider); different economists may have made different choices.
Banerjee & Duflo (2007): Connections
- The paper helps us begin our investigation of development economics and its goals by giving context to the lives of poor households in developing countries. Contrary to theoretical assumptions about behavior, poor households exhibit (un)surprising systematic behaviors that we should consider when designing policy. These results will be used to design future RCTs we will discuss later, including many by these same authors. The paper highlights a central problem with our accounting of wellbeing: what importance or weight should we apply to various features of life? Just because a doctor recommends eating more calories, would a household be happy giving up spending on festivals or alcohol? We observe a disconnect between a normative view (what should households do) and a positive one (what do households do).
Banerjee & Duflo on Hunger and Poverty Traps
If there was any chance that by eating a bit more, the poor could start doing meaningful work and get out of the poverty trap zone, then they should eat as much as possible. Yet, this is not what we see. Most people living with less than 99 cents a day do not seem to act as if they are starving. If they were, surely they would put every available penny into buying more calories. But they do not…Even among the very poor, food expenditures increase much less than one for one with the budget.
— Banerjee & Duflo, pp. 22–23
Banerjee & Duflo on Better-Tasting Calories
Equally remarkable, even the money that people spend on food is not spent to maximize the intake of calories or micronutrients. When very poor people get a chance to spend a little bit more on food, they don’t put everything into getting more calories. Instead, they buy better-tasting, more expensive calories…The puzzle is that people do not seem to want more food, and yet more food and especially more judiciously purchased food would probably make them, and almost certainly their children, significantly more successful in life.
— Banerjee & Duflo, pp. 23, 33
Banerjee & Duflo on Nutrition and Children
The fact that the basic mechanisms of a nutrition-based poverty trap do not seem to be at work for adults does not mean that nutrition is not a problem for the poor. But the problem may be less the quantity of food than its quality, and in particular the shortage of micronutrients. The benefits of good nutrition may be particularly strong for two sets of people who do not decide what they eat: unborn babies and young children. In fact, there may well be an S-shaped relationship between their parent’s income and the eventual income of these children, caused by childhood nutrition.
— Banerjee & Duflo, p. 42
Banerjee & Duflo on Investing in Nutrition
As we saw in India, the poor do not eat any more or any better when their income goes up; there are too many other pressures and desires competing with food. In contrast, the social returns of directly investing in children and pregnant mother nutrition are tremendous. This can be done by giving away fortified food to pregnant mothers and parents of small children, by treating children for worms in preschool or at school, by providing them with meals rich in micronutrients, or even by giving parents incentives to consume nutritional supplements. All of this is already being done in some countries.
— Banerjee & Duflo, pp. 43–44
5-minute Break
Kraay & McKenzie (2014)
Randomly selected presenter: Hennah
What is the research question?
How do the authors answer it?
What do they find?
Are you convinced by the design and results?
How does the paper connect to our other readings?
Group Discussion
Bringing together our lecture material and academic article, I have prepared the following suggested discussion questions:
Why might the poverty trap story be attractive for development economists and policymakers? How does this connect to earlier perspectives in the field?
Does the behavior of individual poor households seem to match this story? Does the aggregate data from country-level comparisons seem to match this story?
How do we typically measure poverty? What are the advantages to these measures? What are the disadvantages?
Roadmap
Looking Ahead to Week 7
What do we have on the horizon before next Tuesday?
My office hours for ECON 672 will be held Tuesday before class, 12:15-2:15pm in MCL 108 or virtually by appointment
Our seventh topic will be Population, fertility, and the household. Our textbook reading will be Chapter 11 and Chapter 10, pp. 272-274. Our Poor Economics reading will be Chapter 5. Our required journal article will be Ashraf, Field, & Lee (2014), “Household Bargaining and Excess Fertility,” AER.
Our Weekly Reading Response assignment for this paper will be due Tuesday at 2:40pm before class. One student will be randomly selected to present their response to the class in 5-8 minutes.